|
The FOMC meets on Tuesday and Wednesday amid universal expectations for the first rate cut since the current target range of 5.25-5.50 percent was set in July last year. What is less universal is the expected size of the cut. There are calls from some Fed watchers for a 50-basis-point reduction due to concerns over the health of the US economy. Yet GDP Nowcasts from Fed district banks are tracking above 2 percent for the third quarter that would follow the second quarter’s 3.0 percent rise. Given this level of economic strength, a 25-point cut is the more realistic expectation.
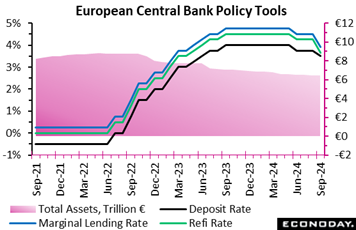 Having left policy on hold in July, the ECB delivered its second interest rate cut of the current cycle. The deposit rate, still the key due to the abundance of excess liquidity, was reduced by 25 basis points to 3.50 percent, matching both market expectations and its lowest level since June 2023. The decision was unanimous. Loose forward guidance was retained, stating that the bank "will keep policy rates sufficiently restrictive for as long as necessary" to achieve the 2 percent inflation target. Having left policy on hold in July, the ECB delivered its second interest rate cut of the current cycle. The deposit rate, still the key due to the abundance of excess liquidity, was reduced by 25 basis points to 3.50 percent, matching both market expectations and its lowest level since June 2023. The decision was unanimous. Loose forward guidance was retained, stating that the bank "will keep policy rates sufficiently restrictive for as long as necessary" to achieve the 2 percent inflation target.
The refi rate was reduced by a larger 60 basis points to 3.65 percent. However, while this might seem to make for a more aggressive ease, the move simply follows the bank's previously stated intention to narrow the spread between it and the deposit rate to 15 basis points. It is the deposit rate that will determine where the level of short-term money rates settle. The rate on the marginal lending facility was similarly reduced by 60 basis points to 3.90 percent.
There was nothing new on quantitative tightening which, since July, has encompassed the €1.7 trillion pandemic emergency purchase programme (PEPP) as well as the longstanding asset purchase programme.
September's cut in rates is justified by the bank's new inflation forecasts. These show headline inflation at 2.5 percent this year, 2.2 percent in 2025 and below target at 1.9 percent in 2026, all unchanged from the June projections. Core inflation over the same period is put at 2.9 percent, 2.3 percent and 2.0 percent respectively. Both the 2024 and 2025 projections are slightly higher than in June but, crucially, the 2025 call is still on target. The bank noted that domestic inflation remains high due to elevated wages but officials still expect cost pressures to moderate going forward and expect reduced profit margins to keep down wage pressures.
In summary, ECB’s statement contained no major surprises. The bank remains data-dependent and so, while leaning in the direction of lower interest rates, will not commit to further easing without the appropriate data. Investors will now turn to the next meeting in October when another cut is clearly possible. However, with the latest move consistent with policy changes being tied to the quarterly forecasting round, it may be that December is the most likely month for the next cut.
 US consumer prices rose 0.2 percent month-over-month and 2.5 percent year-over-year. The monthly change matched Econoday’s consensus while the annual increase was just below the consensus. At least at the all-items level, the CPI continues to work its way lower and is nearer to the Fed’s 2 percent inflation objective. US consumer prices rose 0.2 percent month-over-month and 2.5 percent year-over-year. The monthly change matched Econoday’s consensus while the annual increase was just below the consensus. At least at the all-items level, the CPI continues to work its way lower and is nearer to the Fed’s 2 percent inflation objective.
However, the core CPI – excluding food and energy – was less encouraging. The core rose 0.3 percent on the month and 3.2 percent on the year. The monthly increase was a tenth above the consensus with the annual rate hitting the consensus. Food prices edged a scant 0.1 percent higher in August from July and were up 2.0 percent year-over-year. Energy prices fell 0.8 percent in August from the prior month and were down 4.0 percent compared to August 2023.
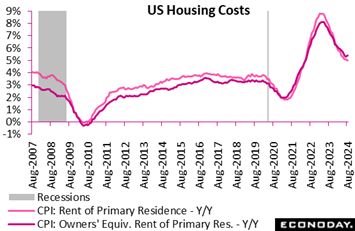
At least in part, the core measure of prices continues to feel ongoing increases in shelter costs. The index for shelter rose 0.5 percent in August from July and the annual increase at 5.2 percent. The year-over-year increase in shelter prices had been coming down since its near-term peak of up 8.2 percent in March 2023 until, however, August’s data when it rose 1 tenth on the month. The CPI for rent was up 0.4 percent in August and up 5.0 percent year-over-year. The CPI for owners' equivalent rent rose 0.5 percent month-over-month and 5.4 percent year-over year.
Excluding shelter only, the CPI was unchanged from the prior month and up 1.1 percent year-over-year. The CPI excluding food, energy, and shelter was up 0.1 percent in August from July and up 1.6 percent from a year ago.
The CPI for commodities fell 0.1 month-over-month and was down 1.2 percent compared to the year-ago month. The CPI for services rose 0.3 percent in August and was up 4.8 percent compared to August 2023. The special aggregate CPI for services less rent was up 0.1 percent and up 4.3 percent on the year.
There is plenty in this report for the FOMC to like in terms of progress on disinflation. Nonetheless, progress is still far more related to the healing in the supply chain and moderation in commodities prices rather than costs for services. Fed policymakers will not view underlying inflation as tamed despite their greater confidence that the trend is sustainably toward the Fed's inflation target. The CPI report does nothing to dampen anticipation of a 25-basis point rate cut when the FOMC meets on September 17-18, but it should counsel that a 50-basis point rate cut is unlikely.
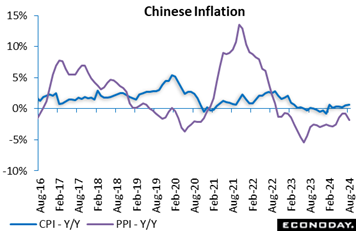 China's headline consumer price index rose 0.6 percent on the year in August, picking up from the 0.5 increase recorded in July. The index rose 0.4 percent on the month after advancing 0.5 percent previously. Producer price inflation data showed ongoing weakness in price pressures. China's headline consumer price index rose 0.6 percent on the year in August, picking up from the 0.5 increase recorded in July. The index rose 0.4 percent on the month after advancing 0.5 percent previously. Producer price inflation data showed ongoing weakness in price pressures.
The CPI increase was driven by prices for clothing, services and other items, offset by weakness in food and fuel prices. Core inflation moderated from 0.4 percent in July to 0.3 percent in August.
China's headline producer price index fell 1.8 percent on the year in August, weakening sharply from a fall of 0.8 percent in July. Headline PPI inflation has been in negative territory since late 2022 and this is the biggest year-over-year decline in the index in four months. The index fell 0.7 percent on the month after a previous decline of 0.2 percent.
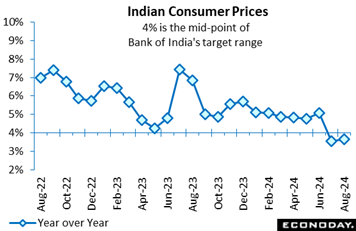 India's consumer price index rose 3.65 percent on the year in August, up slightly from an increase of 3.54 percent in July. This keeps headline inflation below the mid-point of the Reserve Bank of India's target range of 2.0 percent to 6.0 percent for the second consecutive month after it had been above that level since 2019. India's consumer price index rose 3.65 percent on the year in August, up slightly from an increase of 3.54 percent in July. This keeps headline inflation below the mid-point of the Reserve Bank of India's target range of 2.0 percent to 6.0 percent for the second consecutive month after it had been above that level since 2019.
The small move higher in headline inflation was driven by food and fuel prices. Food and beverage prices rose 5.30 percent on the year, up from the 5.06 percent increase recorded previously, while fuel and light charges fell 5.31 percent on the year after a previous decline of 5.48 percent. Inflation in urban areas rose from 3.03 percent in July to 3.14 percent in August, while inflation in rural areas picked up from 4.10 percent to 4.16 percent.
At the RBI's most recent policy meeting, held last month, officials left policy rates on hold at 6.50 percent. Officials noted that base effects and the impact of weather on food prices could result in some volatility in inflation in the near-term, but they repeated their earlier pledge to maintain their "disinflationary stance" until "a durable alignment of the headline CPI inflation with the target is achieved".
 The UK’s July/August labour market report paints another mixed picture with generally tight conditions not resulting in accelerated wage growth. August claimant count unemployment rose 23,700 on the month to 1.792 million, well below the market consensus and also markedly less than July’s 102,300 gain. This was the fifth increase in as many months but small enough to leave the jobless rate steady at 4.7 percent, matching its highest reading since December 2021. The UK’s July/August labour market report paints another mixed picture with generally tight conditions not resulting in accelerated wage growth. August claimant count unemployment rose 23,700 on the month to 1.792 million, well below the market consensus and also markedly less than July’s 102,300 gain. This was the fifth increase in as many months but small enough to leave the jobless rate steady at 4.7 percent, matching its highest reading since December 2021.
ILO data for the three months to July showed joblessness declining 74,000 to 1.437 million, its second successive drop and its second lowest level since November-January. The decrease was sharp enough to trim another tick off this unemployment rate which, at a surprisingly low 4.1 percent, saw its lowest mark since the three months to January. Moreover, employment over the same period was up a hefty 265,000 at 33.232 million, its strongest level since the first quarter of 2023 and high enough to lift the employment rate by 0.3 percentage points to 74.8 percent.
However, by contrast, provisional payroll data for August showed a sizeable 59,000 monthly decline following a 6,000 fall in July. Vacancies also extended their downward spiral in the three months to August. A 42,000 decline to 857,000 marked the steepest drop since the fourth quarter of last year and made for the weakest level since March-May 2021. Even so they remain well above their pre-Covid levels.
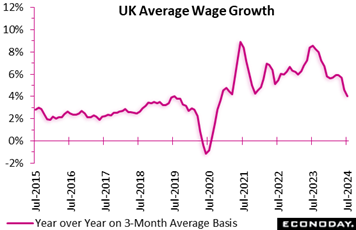
Wage growth eased significantly again and by marginally more than market expectations. At 4.0 percent, average annual growth in the three months to July was well down from 4.6 percent previously, a tick short of forecasts and the slowest since the three months to November 2020. Regular earnings also decelerated but, at 5.1 percent after 5.4 percent, remain historically high.
Consequently, and in line with the prior month's report, the latest update offers something for both the Bank of England’s doves and hawks. That said, neither camp puts much faith in the data amid persistent questions over its quality.
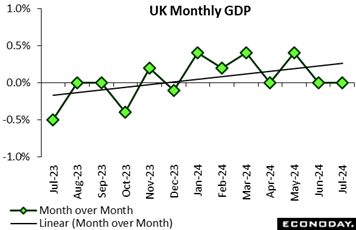 The UK economy stuttered again at the start of the current quarter. July GDP only flatlined at June's level when it also failed to register any growth. This was a tick short of Econoday’s consensus and trimmed the 3-monthly change from 0.6 percent to 0.5 percent. However, annual growth still accelerated from 0.7 percent to 1.2 percent, its strongest reading since June last year. The UK economy stuttered again at the start of the current quarter. July GDP only flatlined at June's level when it also failed to register any growth. This was a tick short of Econoday’s consensus and trimmed the 3-monthly change from 0.6 percent to 0.5 percent. However, annual growth still accelerated from 0.7 percent to 1.2 percent, its strongest reading since June last year.
Services output expanded just 0.1 percent on the month, reversing the previous period's decline, while a 0.8 percent drop in industrial production likewise fully unwound its June advance. Within the latter, manufacturing was down fully 1.0 percent. Elsewhere, construction decreased 0.4 percent following a 0.5 percent advance last time.
The July data were softer than expected and suggest that the economy has lost some momentum in recent months. Indeed, GDP has only expanded once since April. As such, July’s report may be seen as boosting the chances of the BoE lowering Bank Rate again in the coming week. Some members will almost certainly want another 25 basis point cut but, at least until Wednesday's August CPI update, the outcome of the vote remains far from clear.
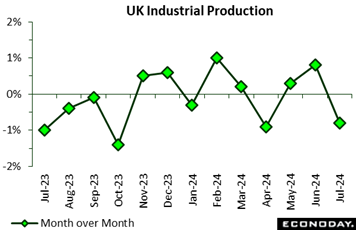 The UK goods producing sector had a poor July, posting a surprisingly steep 0.8 percent monthly fall that fully unwound June's 0.8 percent advance. The decline was the first since April but, with base effects positive, still small enough to boost yearly growth from minus 1.4 percent to minus 1.2 percent. The UK goods producing sector had a poor July, posting a surprisingly steep 0.8 percent monthly fall that fully unwound June's 0.8 percent advance. The decline was the first since April but, with base effects positive, still small enough to boost yearly growth from minus 1.4 percent to minus 1.2 percent.
Manufacturing fared rather worse with a 1.0 percent monthly drop after a 1.1 percent increase previously. Seven of its 13 subsectors recorded losses with the largest negative contributions coming from transport equipment and machinery which recorded falls of 2.3 percent and 4.7 percent, respectively. Wood and paper products, rising 1.6 percent, chalked up the largest increase.
Total output was also boosted by a rise in mining and quarrying (3.9 percent) but negatively impacted by weakness in water supply and sewerage (minus 0.7 percent) and electricity and gas (minus 1.7 percent).
The July report puts the 3-monthly change in overall goods production at minus 0.1 percent and in manufacturing output at minus 0.3 percent.
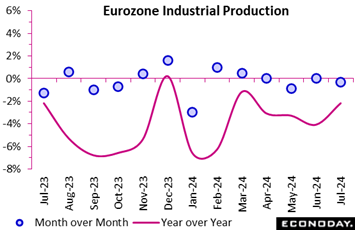 Industrial production in the Eurozone contracted again in July and by a little more than expected. A 0.3 percent monthly drop was a tick steeper than the market consensus and although June's dip was revised away, output has still fallen in three of the last four months. Positive base effects boosted annual growth from minus 4.1 percent to minus 2.2 percent but goods production now stands at its lowest level since September 2020, in the midst of the pandemic. Industrial production in the Eurozone contracted again in July and by a little more than expected. A 0.3 percent monthly drop was a tick steeper than the market consensus and although June's dip was revised away, output has still fallen in three of the last four months. Positive base effects boosted annual growth from minus 4.1 percent to minus 2.2 percent but goods production now stands at its lowest level since September 2020, in the midst of the pandemic.
The latest setback reflected fresh monthly falls in intermediates (1.3 percent), capital goods (1.6 percent) and consumer durables (2.8 percent). Only partial offsets were provided by gains in consumer non-durables (1.8 percent) and energy (0.3 percent).
Regionally the headline contraction was dominated by Germany (minus 3.0 percent) but there were losses too in France (0.5 percent), Italy (0.9 percent) and Spain (0.7 percent). Indeed, the overall decline would have been steeper but for improved performances by a number of the smaller member states.
The July data leave Eurozone industrial production 0.6 percent below its average level in the first quarter. The sector remains a major drag on the region's GDP growth and without a turnaround in Germany, looks likely to remain so for some time yet.
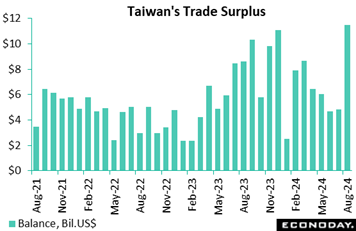 Taiwan's trade surplus widened from $4.83 billion in July to $11.49 billion in August. Exports rose 16.8 percent after increasing 3.1 percent previously, while imports rose 11.8 percent after a previous increase of 16.2 percent. Taiwan's trade surplus widened from $4.83 billion in July to $11.49 billion in August. Exports rose 16.8 percent after increasing 3.1 percent previously, while imports rose 11.8 percent after a previous increase of 16.2 percent.
Stronger headline growth in exports was largely driven by stronger exports of information, communication and audio-video products, up 71.3 percent on the year after advancing 42.4 percent previously, with exports of electronic components also rebounding from a year-over-year decline of 12.0 percent to a small increase of 0.1 percent. Exports to the United States increased 78.5 percent on the year, while exports to mainland China and Hong Kong rose 1.0 percent. Petroleum imports fell on the year, while imports from mainland China and Hong Kong recorded weaker growth.
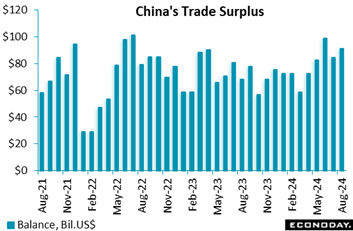 China's trade surplus in US dollar terms widened to $91.02 billion in August from $84.65 billion in July. Exports rose 8.7 percent on the year in August after increasing 7.0 percent in July, while imports rose 0.5 percent on the year, slowing from a previous increase of 7.2 percent. August’s trade surplus was well above Econoday’s consensus estimate of US$82.0 billion. China's trade surplus in US dollar terms widened to $91.02 billion in August from $84.65 billion in July. Exports rose 8.7 percent on the year in August after increasing 7.0 percent in July, while imports rose 0.5 percent on the year, slowing from a previous increase of 7.2 percent. August’s trade surplus was well above Econoday’s consensus estimate of US$82.0 billion.
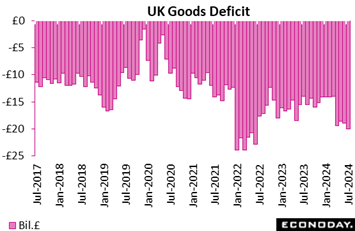 The UK’s global deficit on goods unexpectedly deepened again in July. From £18.89 billion in June, the shortfall rose to £20.00 billion, well above Econoday’s consensus and the largest since April. The deterioration reflected a steep 10.8 percent monthly slump in exports, mainly due to weaker sales of chemicals, that more than offset a 4.6 percent drop in imports. The UK’s global deficit on goods unexpectedly deepened again in July. From £18.89 billion in June, the shortfall rose to £20.00 billion, well above Econoday’s consensus and the largest since April. The deterioration reflected a steep 10.8 percent monthly slump in exports, mainly due to weaker sales of chemicals, that more than offset a 4.6 percent drop in imports.
The deficit with the EU widened from £11.44 billion to £12.50 billion as a 10.8 percent slide in exports easily eclipsed a 2.3 percent fall in imports. However, the shortfall with the rest of the world was essentially unchanged at £7.50 billion with exports also down 10.8 percent and imports off 7.2 percent.
The monthly trade data remain extremely volatile but recent reports suggest that the underlying trend is worsening and the third quarter looks set to record another sizeable deficit.
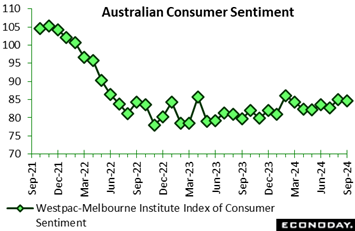 The Westpac-Melbourne Institute index of consumer sentiment fell 0.5 percent to 84.6 in September from its previous level of 85.0. The index continues to bump along historic lows, reflecting ongoing concerns about cost of living pressures and speculation that monetary policy is unlikely to be loosened in coming months. The Westpac-Melbourne Institute index of consumer sentiment fell 0.5 percent to 84.6 in September from its previous level of 85.0. The index continues to bump along historic lows, reflecting ongoing concerns about cost of living pressures and speculation that monetary policy is unlikely to be loosened in coming months.
Respondents to the survey reported weaker confidence in the outlook for the domestic economy over the next twelve months and five years. Weak GDP data published during the survey period were cited as a factor contributing to this deterioration. This was partly offset by slightly improved sentiment about the outlook for family finances over the next twelve months and five years, with fewer respondents expecting mortgage rates to rise over the next twelve months.
The NAB business survey for Australia showed weaker conditions and weaker confidence in August. The survey's business conditions index fell from 6 in July to 3 in August, with respondents reporting weaker profitability, trading conditions and employment and a steady decline in forward orders. The survey also showed slightly stronger increases in purchase costs and retail prices but weaker growth in labour costs. The survey's business confidence fell from 1 in May to minus 4 in June. Sentiment weakened across most sectors and remains well below its long-run average.
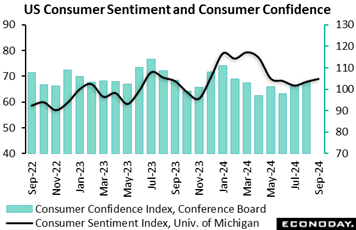 The preliminary University of Michigan consumer sentiment index for September edged higher to 69.0 from the final reading of 67.9 in August and 67.9 in September 2023. The latest reading was 1 point above Econoday’s consensus and is the highest since 69.1 in May. Consumers, nevertheless, remain cautious. Though inflation appears to be cooling and the labor market is not worsening, there is still a contentious presidential election to get through. Nonetheless, prospects of lower interest rates are likely lifting the economic outlook for consumers. The preliminary University of Michigan consumer sentiment index for September edged higher to 69.0 from the final reading of 67.9 in August and 67.9 in September 2023. The latest reading was 1 point above Econoday’s consensus and is the highest since 69.1 in May. Consumers, nevertheless, remain cautious. Though inflation appears to be cooling and the labor market is not worsening, there is still a contentious presidential election to get through. Nonetheless, prospects of lower interest rates are likely lifting the economic outlook for consumers.
The index for current economic conditions is up 1.6 points so far this month to 62.9, more than erasing the decline to 61.3 in August. The index of consumer expectations is up 0.9 points to 73.0, the highest since 76.0 in April.
The one-year inflation expectations measure is down a tenth to 2.7 percent and is the lowest since 2.5 percent in December 2020. This suggests that underlying inflation is getting back to normal in the short term. However, the five-year measure is up a tenth to 3.1 percent and is the highest since May 2023. This measure is more in line with the Fed's concept of the medium-term price horizon. There's a hint here that while commodities prices have moderated, upward pressures for services are not abating and will continue to be a source of future inflation.
Global economic data continue to underperform relative to forecasts. Econoday’s Relative Performance Index (RPI) fell 6 points in the week to minus 16 and edged a further 3 points lower to minus 20 less prices (RPI-P), the latter indicating that real economic activity has been, as it has for the last six weeks, subpar relative to expectations.
By contrast, US data continue to come in very close to Econoday’s consensus estimates, at plus 4 overall and plus 2 excluding prices. Without a bias relative to expectations and with economic growth generally sound, debate at Wednesday’s FOMC, that is whether to cut by 25 or by 50 basis points, looks to be balanced.
There were no significant data releases in Canada leaving the RPI at plus 1 and the RPI-P at minus 1. Economic activity is moving in line with generally weak market forecasts for this economy meaning that not only is another 25 basis point ease by the Bank of Canada next month a probability, but even a larger 50 basis point move is at least a possibility.
In the Eurozone, the RPI and RPI-P remain close to zero at minus 3 and minus 12 respectively. However, in effectively meeting market expectations, recent data were still soft enough to justify the European Central Bank’s 25-basis-point cut and will underpin speculation about further easing by year-end.
Ahead of Thursday’s Bank of England announcement, Wednesday’s August CPI report could yet tip forecasters towards another cut in Bank Rate. As it is, the economic data have generally surprised modestly on the downside since the last meeting in August, boosting the case of the MPC’s doves. The RPI currently stands at minus 9 and the RPI-P at minus 15.
In Japan, the RPI (minus 40) and, in particular, the RPI-P (minus 61) fell further below zero. The Bank of Japan still looks set to raise interest rates again so long as future inflation meets its expectations but the surprising weakness of recent data strengthen the case for a very cautious approach.
The China RPI and RPI-P fell from minus 36 to minus 43 and from minus 30 to minus 20 respectively, indicating that recent Chinese data, as they have for much of the year, continue to come in well below consensus forecasts.
**Contributing to this article were Jeremy Hawkins, Brian Jackson, Mace News, Max Sato, Olajide Oyadeyi, and Theresa Sheehan
The week begins early, on Saturday Chinese time with the country’s release of monthly industrial production and retail sales data, both of which are expected to slow appreciably. The Federal Reserve, despite indications of continued economic strength, is expected to cut rates by 25 basis points on Wednesday. The Bank of England is expected to hold policy steady on Thursday as are the People’s Bank of China and the Bank of Japan, both on Friday.
Canadian consumer prices on Tuesday are expected to break lower to a near target 2.1 percent. UK consumer prices on Wednesday, which will help inform Thursday’s BoE meeting, are expected to hold steady at 2.2 percent.
US retail sales on Tuesday are expected to show underlying strength in contrast to US industrial production which, also posted on Tuesday, is expected to remain flat. The first estimate of New Zealand GDP on Thursday is expected to contract a quarterly 0.4 percent followed by Australia’s August labour force survey, which also on Thursday, is expected to show continued strength.
Chinese Fixed Asset Investment for August (Sat 1000 CST; Sat 0200 GMT; Fri 2200 EDT)
Consensus Forecast, Year-to-Date on Y/Y Basis: 3.5%
Fixed asset investment for the year-to-date to August is expected to rise 3.5 percent. This would compare with 3.6 percent in July which missed expectations for 3.9 percent.
Chinese Industrial Production for August (Sat 1000 CST; Sat 0200 GMT; Fri 2200 EDT)
Consensus Forecast, Year over Year: 4.6%
Year-over-year growth in industrial production rose a lower-than-expected 5.1 percent in July after 5.3 percent growth in June. Expectations for August is 4.6 percent.
Chinese Retail Sales for August (Sat 1000 CST; Sat 0200 GMT; Fri 2200 EDT)
Consensus Forecast, Year over Year: 2.3%
After rising a slightly higher-than-expected 2.7 percent in July, year-over-year sales in August are expected to slow to 2.3 percent.
Canadian Manufacturing Sales for July (Mon 08:30 EDT; Mon 1230 GMT)
Consensus Forecast, Month over Month: 1.1%
Manufacturing sales in July are expected to rebound 1.1 percent on the month. This would compare with a 2.1 percent decline in June and 0.4 percent rise in May.
Germany: ZEW Survey for September (Tue 1100 CEST; Tue 0900 GMT; Tue 0500 EDT)
Consensus Forecast, Economic Sentiment: 17.5
ZEW’s expectations component (economic sentiment), which in the last report fell steeply from 41.8 to 19.2, is seen falling further to 17.5.
Canadian Housing Starts for August (Tue 0815 EDT; Tue 1215 GMT)
Consensus Forecast, Annual Rate: 251,000
Housing starts are expected to slow to 251,000 in August versus July’s much higher-than-expected 279,509.
Canadian CPI for August (Tue 0830 EDT; Tue 1230 GMT)
Consensus Forecast, Month over Month: 0.1%
Consensus Forecast, Year over Year: 2.1%
After July’s as-expected 2.5 percent rate that was down from June’s 2.7 percent, consumer prices in August are expected to cool further to 2.1 percent.
US Retail Sales for August (Tue 0830 EDT; Tue 1230 GMT)
Consensus Forecast, Month over Month: -0.3%
Consensus Forecast, Ex-Vehicles - M/M: 0.3%
Consensus Forecast, Ex-Vehicles, Ex-Gas - M/M: 0.3%
Due to weak unit vehicle sales, August retail sales are expected to fall 0.3 percent versus a much higher-than-expected 1.0 percent jump in July that benefited from a strong month for vehicle sales. July’s ex-auto sales increased a less striking 0.4 percent with August expected to rise 0.3 percent; August ex-auto ex-gas are also expected at plus 0.3 percent.
US Industrial Production for August (Tue 1315 GMT; Tue 0915 EDT)
Consensus Forecast, Month over Month: 0.1%
Consensus Forecast, Manufacturing Output - M/M: 0.0%
Consensus Forecast, Capacity Utilization Rate: 77.9%
Industrial production in August is expected to edge 0.1 percent higher after July’s deeper-than-expected 0.6 percent fall tied in part to the effects of Hurricane Beryl. Manufacturing output, which fell 0.3 percent in July, is expected to come in unchanged. Capacity utilization is expected to edge higher to 77.9 percent following 77.8 percent in July.
Japanese Merchandise Trade for August (Wed 0850 JST; Tue 2350 GMT; Tue 1950 EDT)
Consensus Forecast: -¥1,456 billion
Consensus Forecast, Imports Y/Y: 13.7%
Consensus Forecast, Exports Y/Y: 10.0%
A deficit of ¥1,456 is the consensus for August’s trade balance versus a deficit of ¥628.7 billion in July. Both imports and exports posted strong year-over-year gains in July but especially imports which surged 16.6. percent.
UK CPI for August (Wed 0700 BST; Wed 0600 GMT; Wed 0200 EDT)
Consensus Forecast, Month over Month: 0.2%
Consensus Forecast, Year over Year: 2.2%
A 2.2 percent overall rate in July was up from 2.0 percent in June but was no surprise for the Bank of England which had already expected headline inflation to rise over the latter half of the year. August’s consensus is no change at 2.2 percent.
US Federal Reserve Announcement (Wed 1800 GMT; Wed 1400 EDT)
Consensus Forecast, Policy Rate Change: -25 basis points
Consensus Forecast, Target Range: 5.00 to 5.25 percent
The Fed is widely expected to cut rates, not by 50 basis points, but by an incremental 25 basis points to a range of 5.00 to 5.25 percent. The meeting will also include quarterly forecasts that will update how much the FOMC expects to cut rates in coming meetings.
New Zealand Second-Quarter GDP (Thu 1045 NZST; Wed 2245 GMT; Wed 1845 EDT)
Consensus Forecast, Quarter over Quarter: -0.4%
Consensus for second-quarter GDP is quarter-over-quarter contraction of 0.4 percent in what would be a shift lower from 0.2 percent growth in the first quarter.
Australian Labour Force Survey for August (Thu 1130 AEST; Thu 0130 GMT; Wed 2130 EDT)
Consensus Forecast, Employment: 31,000
Consensus Forecast, Unemployment Rate: 4.2%
Employment in August is expected to rise 31,000 versus July’s much stronger-than-expected 58,200 increase. Employment growth has exceeded Econoday’s consensus estimate the last four reports in a row. Unemployment is expected to hold at 4.2 percent.
Bank of England Announcement (Thu 1200 BST; Thu 1100 GMT; Thu 0700 EDT)
Consensus Forecast, Change: 0 basis points
Consensus Forecast, Level: 5.00%
Inflation levels remain above target and wage growth remains high, yet underlying trends seem to be moving in the right direction. Thursday’s announcement may well be another very close call but Bank Rate is expected to be left at 5.00 percent.
China Loan Prime Rates (Fri 0915 CST; Fri 0115 GMT; Thu 2115 EDT)
Consensus Change: 1-Year Rate: 0 basis points
Consensus Level: 3.35%
Consensus Change: 5-Year Rate: 0 basis points
Consensus Level: 3.85%
Officials are expected to hold loan prime rates unchanged at September’s announcement: at 3.35 percent for the 1-year rate and 3.85 percent for the 5-year. The People’s Bank of China left both rates unchanged at their August meeting after cutting them by 10 basis points each at their July meeting.
Bank of Japan Announcement (Expected sometime between 11:30 and 12:00 JST on Friday, September 20)
Consensus Forecast, Change: 0 basis points
Consensus Forecast, Level: 0.25%
After incrementally raising rates in July to an overnight level of 0.25 percent, the Bank of Japan is expected to hold policy unchanged.
UK Retail Sales for August (Fri 0700 BST; Fri 0600 GMT; Fri 0200 EDT)
Consensus Forecast, Year over Year: 1.3%
Volumes rose a lower-than-expected 0.5 percent in July after falling 0.9 percent in June. Forecasters see a rebound for August, calling for a 1.3 percent rise.
German PPI for August (Fri 0800 CEST; Fri 0600 GMT; Fri 0200 EDT)
Consensus Forecast, Month over Month: -0.1%
Consensus Forecast, Year over Year: -1.0%
After rising an as-expected 0.2 percent on the month in July, August’s PPI is seen down 0.1 percent. Year-over-year, the PPI is expected at minus 1.0 percent versus July’s minus 0.8 percent.
French Business Climate Indicator for September (Fri 0845 CEST; Fri 0645 GMT; Fri 0245 EDT)
Consensus Forecast: 99
After rebounding 4 points in August to 99 and back near its long-term average of 100, sentiment in French manufacturing is expected to hold unchanged in September.
Canadian Retail Sales for July (Fri 0830 EDT; Fri 1230 GMT)
Consensus Forecast, Month over Month: 0.6%
Retail sales in July are expected to rebound 0.6 percent on the month after falling 0.3 and 0.8 percent in the two prior months.
Eurozone: EC Consumer Confidence Flash for September (Fri 1600 CEST; Fri 1400 GMT; Fri 1000 EDT)
Consensus Forecast: -13.3
Consumer confidence in September is expected to hold steady at minus 13.3 versus minus 13.4 in August which was the first month since January that the gauge did not strengthen.
|
